

Shivaan Asset Management

Oil & Gas

Turning Decades of Maintenance Text into Reliability Intelligence

Shivaan Asset Management used custom AI agents to classify 3,126 historical maintenance work orders for ball valves against a standards-aligned failure-mode taxonomy, in a single batch run.

Work orders analysed and classified
3,126
In a single batch run against the ball valve failure-mode taxonomy
Successfully classified
99.2%
3,102 of 3,126. The 24 that did not had nothing recorded against them
Average confidence on actionable results
76.4%
The strongest classifications reached 90 per cent plus

In brief

  • A global oil and gas operator held decades of maintenance work-order history for ball valves, but it lived as inconsistent free text that had never been mapped to a failure-mode taxonomy.
  • Shivaan Asset Management ran a proof of concept using custom AI agents to structure each work order against a clean, standards-aligned failure-mode and effects taxonomy.
  • 3,126 historical work orders were analysed and classified in a single batch run, with a 99.2 per cent success rate.
  • The dominant failure patterns, the most failure-prone components and the leading causes of failure were surfaced and ranked for the reliability team.
  • Every result carried a confidence level, and ambiguous or out-of-scope records were flagged for review rather than forced into a false match.

The Challenge

A global oil and gas operator held decades of maintenance work-order history for ball valves, a single asset class type, or in SAP terms a single technical object type. That history carried valuable failure information, but it lived as inconsistent, unstructured free text and had never been mapped to a standard failure-mode taxonomy.

As a result, the organisation could not reliably see what was actually failing, why, or how often. A large and valuable body of data could not properly inform its reliability, maintenance-strategy, spares or design decisions.

Our Approach

Shivaan Asset Management ran a proof of concept applying custom AI agents to a large body of the operator's historical maintenance work orders for the ball valve asset class type.

  • Structured each free-text work order against a clean, standards-aligned failure-mode and effects (FMEA) taxonomy, mapping records to component, failure mechanism and cause of failure.
  • Attached a confidence level to every classification, and separated confident results from those needing human review.
  • Flagged records that fell outside the taxonomy, and records that were not genuine failures such as preventive or testing activities, rather than forcing a false match.
  • Surfaced and ranked the dominant failure patterns, the most failure-prone components and the leading causes of failure across the whole dataset.

The taxonomy itself was deliberately rich rather than coarse, so a classification stayed specific enough to act on: a named component, a named failure mechanism and a named cause, not a broad category.

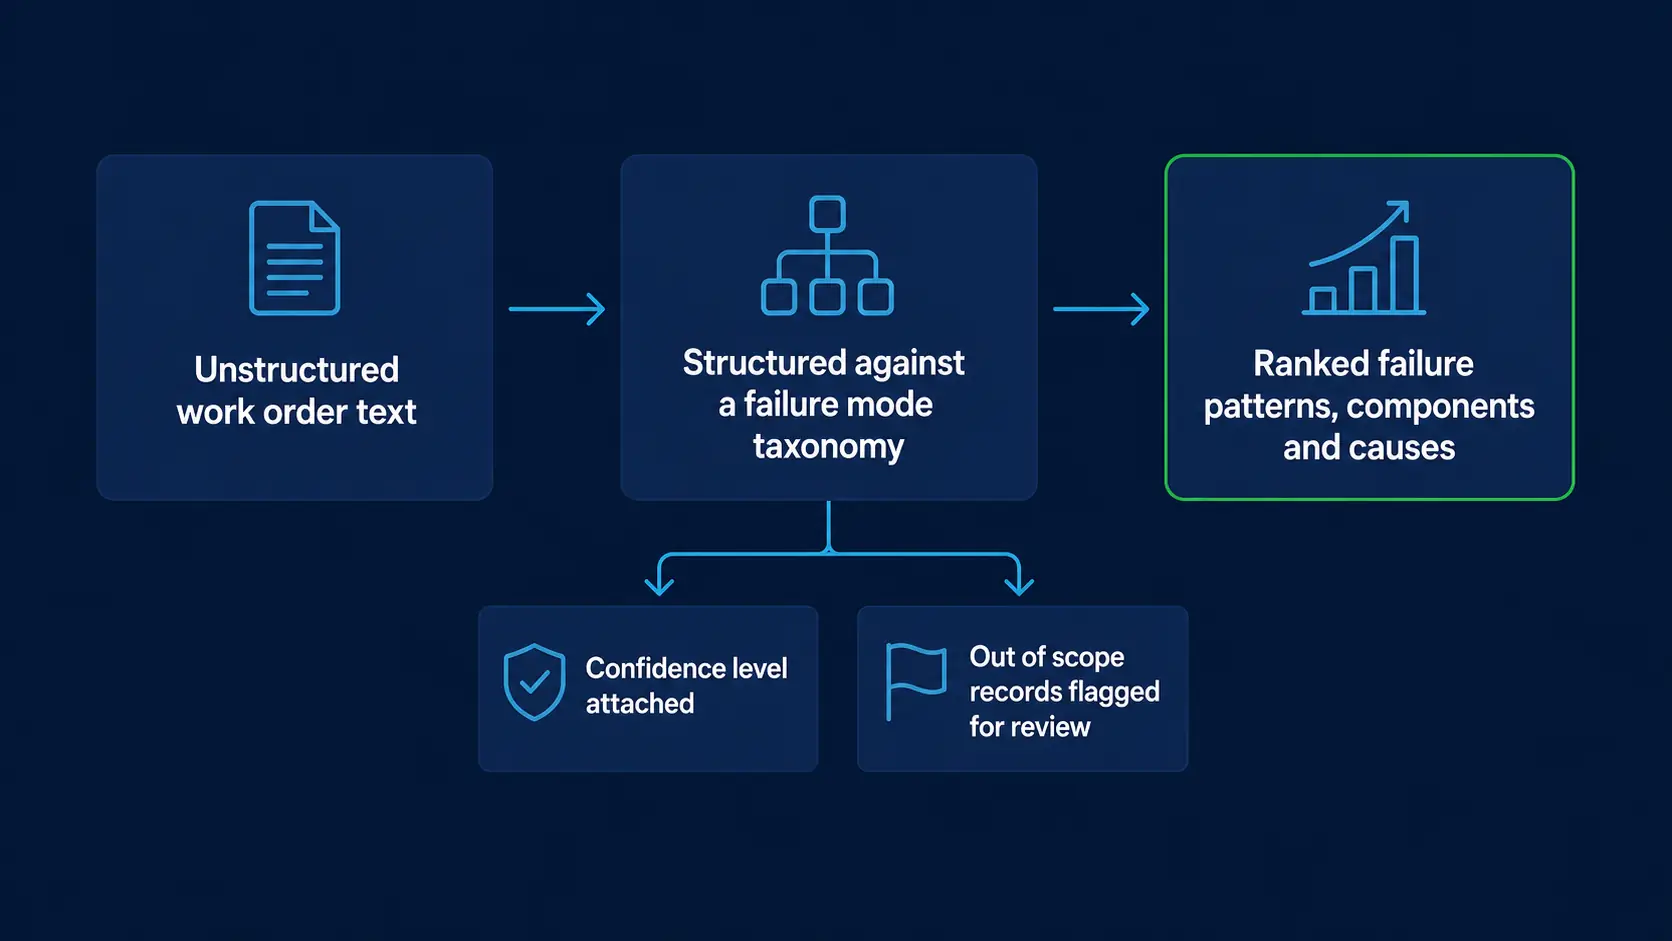
Process diagram: unstructured work order text is structured against a failure mode taxonomy and then ranked into failure patterns, components and causes, with a branch showing a confidence level attached to each result and out of scope records flagged for review.
Free text goes in one end. What is failing, why, and how sure we are comes out the other.

The Results

The whole history was read in one run. These are the numbers that came out of it, and what each one means.

Work orders read
3,126
Every ball valve work order in the history supplied, read and sorted in a single batch run.
Classified successfully
3,102
99.2 per cent of the total. Each one matched to a component, a failure mechanism and a cause of failure.
Could not be classified
24
Nothing had been recorded against these work orders. With no information, text or data written against them, there was nothing to read.
Ready to act on
2,286
73.7 per cent of the classified records came back as actionable results the reliability team could use directly.
Average confidence
76.4%
How certain the classification was across the actionable results. The strongest reached 90 per cent and above.
Carried a second failure mode
1,273
40.7 per cent of work orders described more than one failure. A single code would have lost the rest.

What came out of it

  • 3,126 work orders were read and classified in a single batch run, with 99.2 per cent successfully classified.
  • The most frequent failure patterns, the components failing most often and the leading causes of failure were identified and ranked.
  • Records that needed a human eye, or a wider taxonomy, were flagged for review rather than forced into a match, so engineering effort went where it counted.
  • An interactive results dashboard and a prioritised recommendations list were delivered to the reliability team.

The Value Delivered

  • Turns years of unstructured maintenance text into structured, analysable reliability intelligence.
  • Reveals what is actually failing, and why, at scale, to support targeted maintenance strategy, spares and design decisions.
  • Completes in a single batch run what would otherwise take months or years by hand, and what in most organisations never gets done at all, because it is far too time consuming for engineers who are already inundated with other priorities.
  • Stays transparent and defensible: every result carries a confidence level, and ambiguous or out-of-scope records are flagged rather than force-fitted, so engineers review only where it counts.
  • Exposes gaps in the existing failure-mode taxonomy so it can be improved over time.
  • Highlights dominant, recurring failure mechanisms such as sealing and fastening issues that warrant a maintenance-strategy or work-instruction review.

Why failure code integrity decides what your CMMS data is worth

Frequently asked questions

What problem does this solve for an asset-heavy operator?

It turns decades of inconsistent, free-text maintenance work orders into structured, taxonomy-aligned failure-mode intelligence, so an operator can finally see what is actually failing, why, and how often, to inform maintenance strategy, spares and design decisions.

How much data was processed, and how accurately?

In this proof of concept, 3,126 historical work orders for the ball valve asset class type were analysed and classified in a single batch run, with a 99.2 per cent success rate and 76.4 per cent average confidence across the actionable results.

How do you keep the results trustworthy?

Every classification carries a confidence level. Confident results are separated from those needing human review, and records that fall outside the taxonomy, or that are not genuine failures, are flagged rather than forced into a false match.

How long would this take a team to do manually?

By hand it is a months or years job, and in most organisations it never gets done at all. Reading and classifying thousands of work orders against a failure-mode framework is simply too time consuming for engineers who are already inundated with other priorities. This was completed in a single batch run.

Related projects

What is your maintenance history not telling you?

Most operators are sitting on the same dormant asset: years of work-order text that could sharpen reliability, spares and design decisions if it were readable. We would welcome a conversation about what yours could reveal.