
In brief
- Reliability has a precise definition and has had one for decades: the probability that an item performs a required function, under stated conditions, for a stated period of time.
- An item does not have a reliability the way it has a mass, because reliability is a statement about how a population behaves over an interval, inferred from data rather than read off one machine.
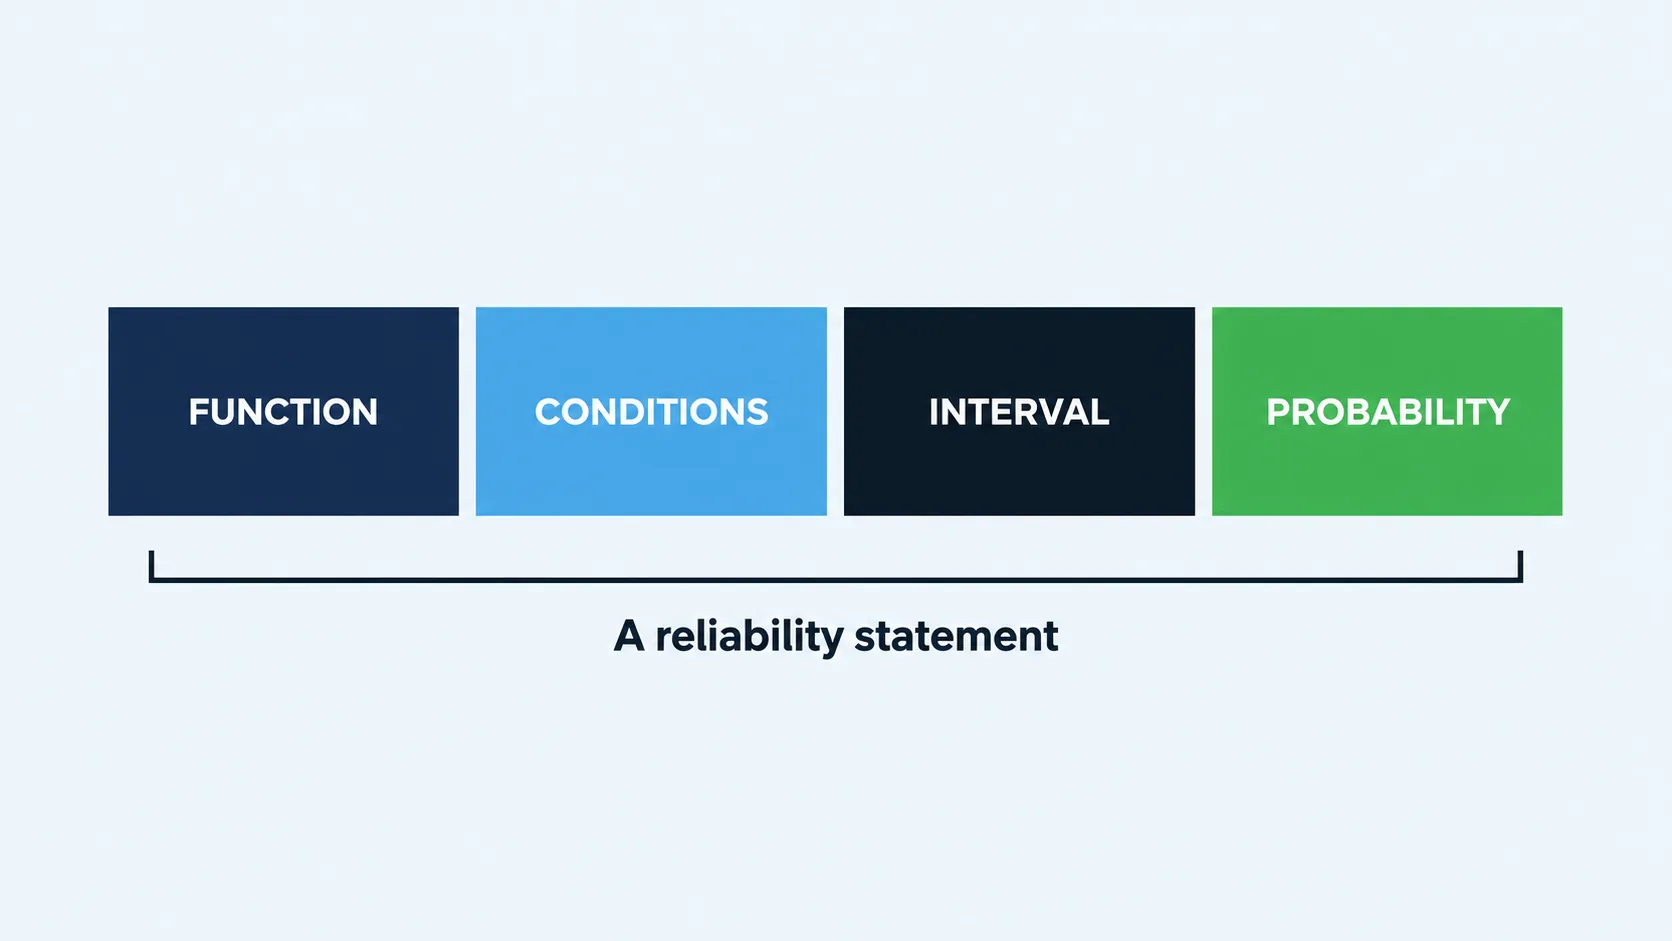
- The four elements are the required function and its performance standard, the operating conditions, the stated interval on the right clock, and the probability itself, and every one of them is load bearing.
- Calendar time is the default in every budget cycle and it is usually the wrong base for reliability, because the right clock is the variable the damage mechanism actually tracks.
- Reliability, availability, maintainability and safety are four separate questions about the same asset, and two pumps with an identical availability figure can be nothing like each other to own.
Ask ten engineers on the same site whether a particular pump is reliable and you will get ten answers, every one of them sincere and none of them usable. The reason is not disagreement about the pump. It is that "reliable" on its own is an adjective, and reliability engineering is not built on adjectives. It is built on a probability, and a probability needs several things attached to it before it means anything at all.
Reliability has a precise definition and has had one for decades: the probability that an item performs a required function, under stated conditions, for a stated period of time (ISO 14224:2016; MIL-HDBK-338B 1998). Four elements sit inside that sentence and every one is load bearing. Remove any single element and what remains cannot be calculated, tested, budgeted or improved. That is the difference between a reliability programme that produces decisions and one that produces opinions.
This page takes the definition apart element by element, shows what each one contributes and shows exactly what breaks when one goes missing. It then separates reliability from the three concepts most often confused with it, using two pumps that share an identical availability figure and could not be more different to own. Everything else in reliability engineering is built on the definition assembled here.
Reliability Is a Probability, Not a Property
An item does not have a reliability the way it has a mass.
Mass is a property you measure on one object, once, and get an answer. Reliability is a statement about how a population behaves over an interval, expressed as a probability. If T is the random variable representing the time at which an item fails, reliability is the probability that T exceeds the time of interest.
- R(t)
- the reliability function, the probability of surviving to time t
- T
- the time to failure, treated as a random variable
- t
- the specific time or interval of interest
Because failure either has or has not occurred by time t, reliability and its complement account for the whole population.
- F(t)
- the cumulative distribution function, the probability of having failed by time t, sometimes called unreliability
Three consequences follow immediately, and each one shapes practice.
First, reliability is inferred from a population, not read off one machine. One pump that has run 4,000 hours tells you very little on its own. Twenty pumps of the same class, with their ages and outcomes recorded, tell you a great deal. Reliability engineering is a data discipline before it is a mathematical one.
Second, reliability is a function of time, never a single number. R is written R(t) because it declines as the interval extends, and any figure quoted without its interval is incomplete.
Third, reliability is bounded between zero and one and can never be improved to certainty. A reliability programme moves the curve, and how far it can be moved for what cost is the actual engineering problem.
Element One: A Required Function and Its Performance Standard
You cannot define failure until you have defined success.
The first element of the definition is the required function, and it carries a companion that is easy to leave out: the performance standard against which that function is judged. A vibrating screen's function is not "to vibrate". It is to separate feed into specified size fractions at a specified throughput and a specified efficiency. Once that is written down, failure becomes definable, because failure is the loss of ability to perform the required function (ISO 14224:2016).
This is why functional failure definition precedes all failure analysis (SAE JA1012). Without a performance standard there is no boundary, and without a boundary the same event gets recorded as a failure by one shift and as normal operation by the next. That inconsistency propagates into the data set, and any life analysis built on it inherits the ambiguity.
A useful discipline is to write the performance standard as a measurable limit with a unit, a measurement method and a location. "Screening efficiency not less than 85%, measured by belt cut at the oversize discharge" is a standard. "Screens properly" is not. The first can be observed, recorded, argued about with evidence and analysed. The second cannot.
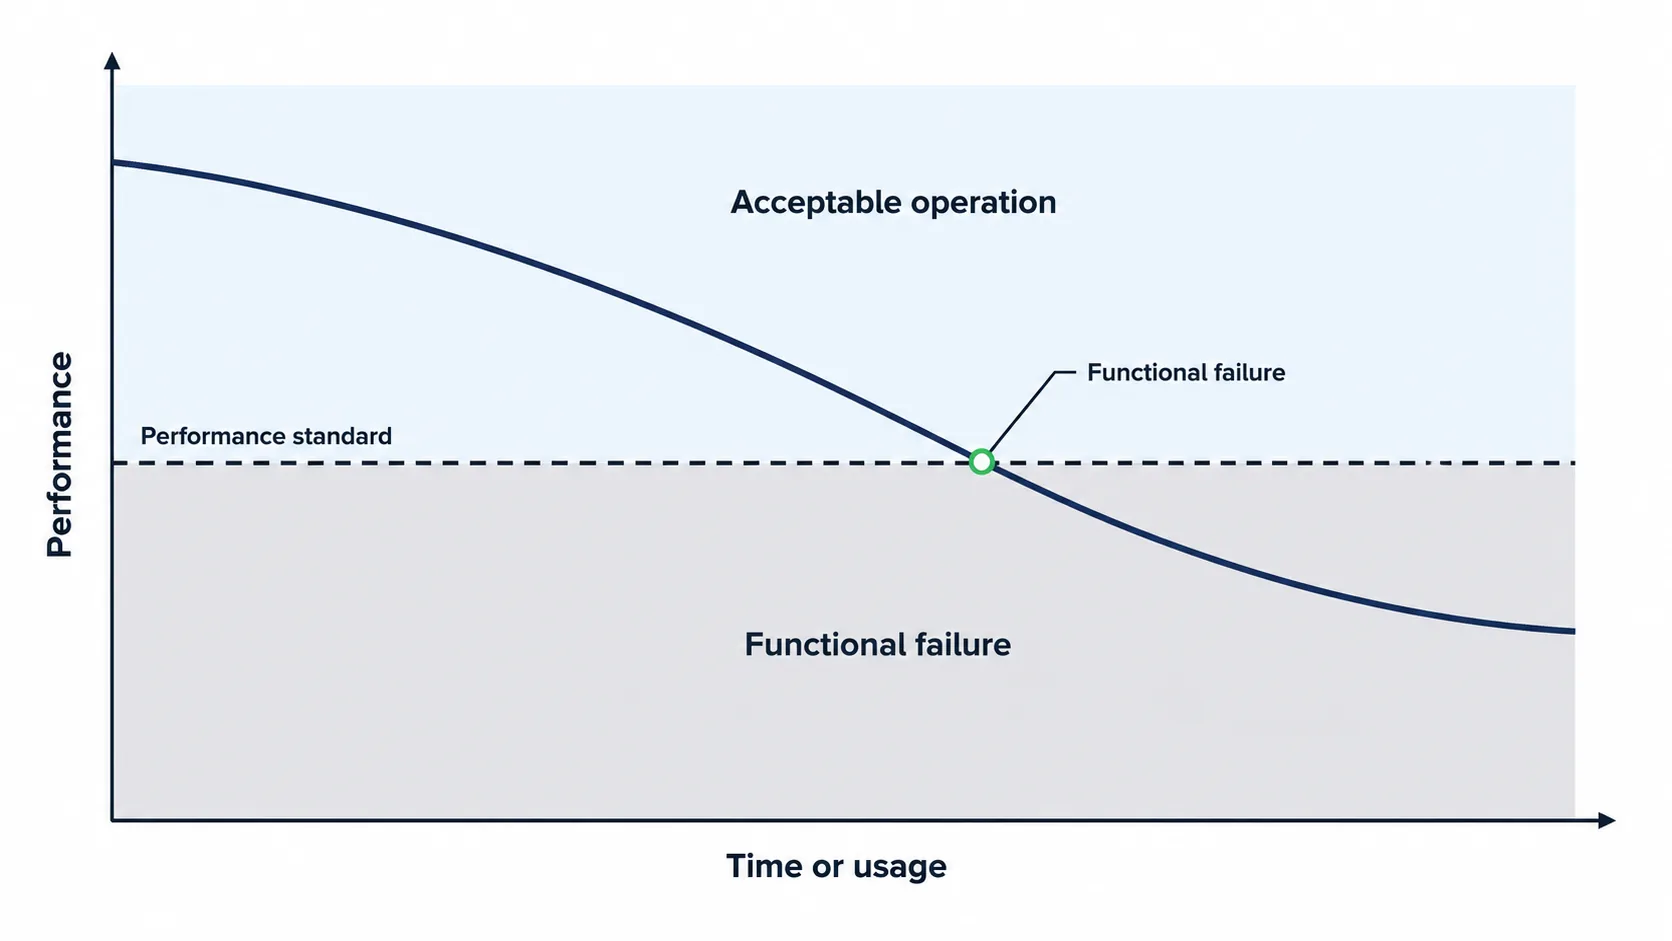
One further point matters for anyone building a reliability data set. An item can have several required functions and can fail against one while still satisfying another. A pump that moves fluid but no longer meets its seal-leakage standard has suffered a functional failure even though it is still pumping. Treating that as "not a failure" is how a fleet comes to look more reliable on paper than it is in the plant.
Element Two: The Conditions Under Which the Function Is Required
The same item, doing the same job, has a different reliability in a different environment.
The second element is the operating context: duty, load, speed, temperature, ambient conditions, feed characteristics, operating pattern and the competence of the people running and maintaining it. A reliability figure is a statement about a specific context, and it does not transfer intact to a different one.
This is not a marginal correction. A slurry pump handling abrasive feed at high solids concentration and a pump of the same model on clean water are, for reliability purposes, two different populations, and pooling their failure data produces a distribution that describes neither. The same applies to a conveyor idler in a dusty, high-ambient environment against one indoors, or a transformer at continuous full load against one lightly loaded.
Two practical rules come out of this. When analysing, define the context and include only items that share it. When quoting a reliability figure, state the context, because a figure without its context invites exactly the misapplication that discredits reliability work.
Operating context is also where the honest limits of published or manufacturer reliability data sit. A number established under one set of conditions is evidence and it is worth having. It is not a prediction for your conditions, and the gap between the two is a legitimate engineering question rather than an inconvenience.
Element Three: A Stated Interval, and the Right Clock to Measure It
Reliability without a time base is an unfinished sentence.
The third element is the interval over which the function must be performed. It is the element most often omitted, and omitting it is what allows a reliability claim to sound strong while committing to nothing. "This gearbox is 95% reliable" is not a claim. "This gearbox has a 95% probability of completing 8,000 operating hours at rated load without a functional failure" is.
The subtler question is not the length of the interval but the choice of clock. Calendar time is the default in every budget cycle and it is usually the wrong base for reliability, because damage accumulates with use rather than with the passage of days.
Consider two haul trucks in the same fleet across one calendar year. The high-utilisation unit runs 18 hours a day and accrues 6,570 operating hours. The standby unit runs 6 hours a day and accrues 2,190. On the calendar clock they are the same age. On the operating-hour clock one has done three times the work of the other. Analysed on calendar time, these two units appear to be the same age and their very different failure behaviour looks like random scatter. Analysed on operating hours, the pattern resolves.
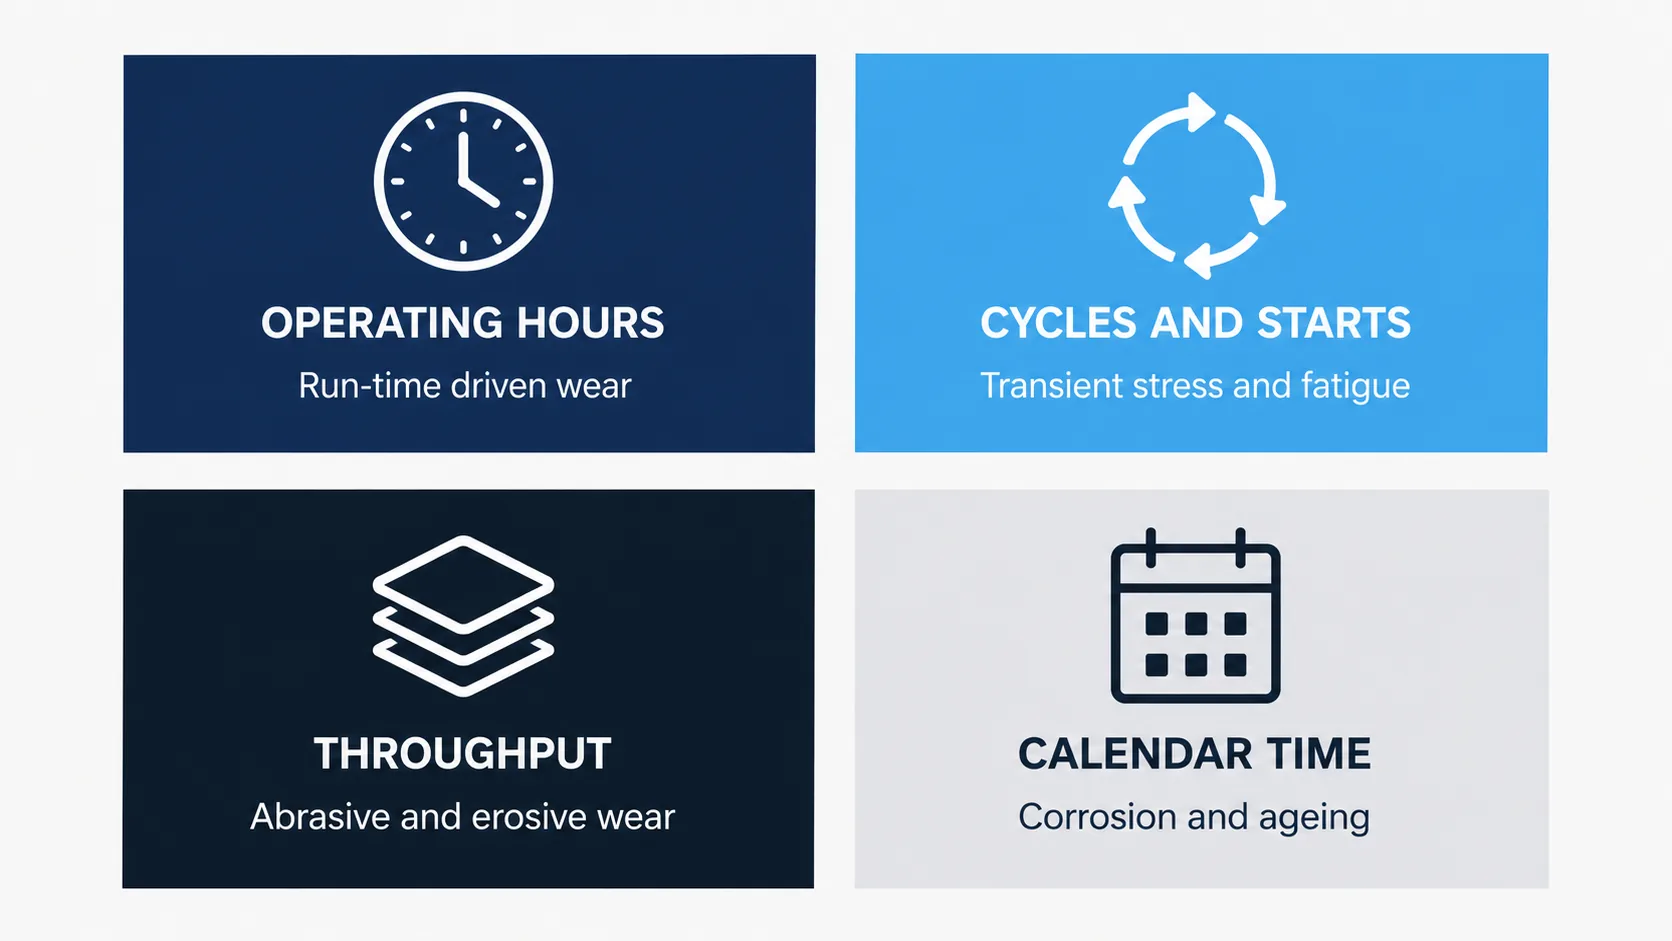
Choosing the clock is an engineering judgement about the damage mechanism, and the right answer is the variable the damage actually tracks.
- Operating hours suit mechanisms driven by run time, such as bearing fatigue under steady load, lubricant degradation and continuous wear.
- Cycles or starts suit mechanisms driven by transient stress, such as thermal fatigue in a fired heater tube or crack initiation in a structure that is repeatedly loaded and unloaded.
- Throughput, in tonnes or cubic metres, suits mechanisms driven by material passing through, such as abrasive wear on a mill liner, a chute or a pump wet end.
- Calendar time genuinely suits time-driven mechanisms such as atmospheric corrosion, elastomer ageing and desiccant saturation, which progress whether or not the asset runs.
Get this wrong and the analysis is not merely imprecise, it answers a different question from the one you asked. A good deal of analysis that appears to show "random" failure is analysis performed on the wrong clock.
Element Four: The Probability, and What It Is a Probability Of
The fourth element is the one people think is the whole definition, and it is the one that means least on its own.
A probability is only interpretable once the other three elements have fixed what it is a probability of. Given a function, a performance standard, a context and an interval, the probability becomes a specific, testable, falsifiable claim about a population. Without them it is a number attached to a feeling.
The probability also has to be stated in a form that carries its own precision. Quoting 0.94 to two decimal places is a claim about the strength of the evidence as much as about the equipment, and a data set of six failures cannot support it. This is why sample size, censoring and confidence bounds matter, and the series returns to each of them in detail.
Putting the Four Elements Together
Watch what happens to a vague statement when the elements are added one at a time.
Start with what a plant walk-around actually produces: "the primary screen is reliable." Add the function and its performance standard, and it becomes "the primary screen separates feed into specified fractions at not less than 85% screening efficiency." Add the operating context: "at design feed rate, design top size and up to 8% surface moisture." Add the interval on the right clock: "across a 1,000-hour production campaign." Add the probability: "with a 0.94 probability of no functional failure."
Assembled, it reads as one sentence a reliability engineer can act on. A primary screen of this class, screening at design feed rate, design top size and up to 8% surface moisture, has a 0.94 probability of completing a 1,000-hour production campaign without screening efficiency falling below 85%.
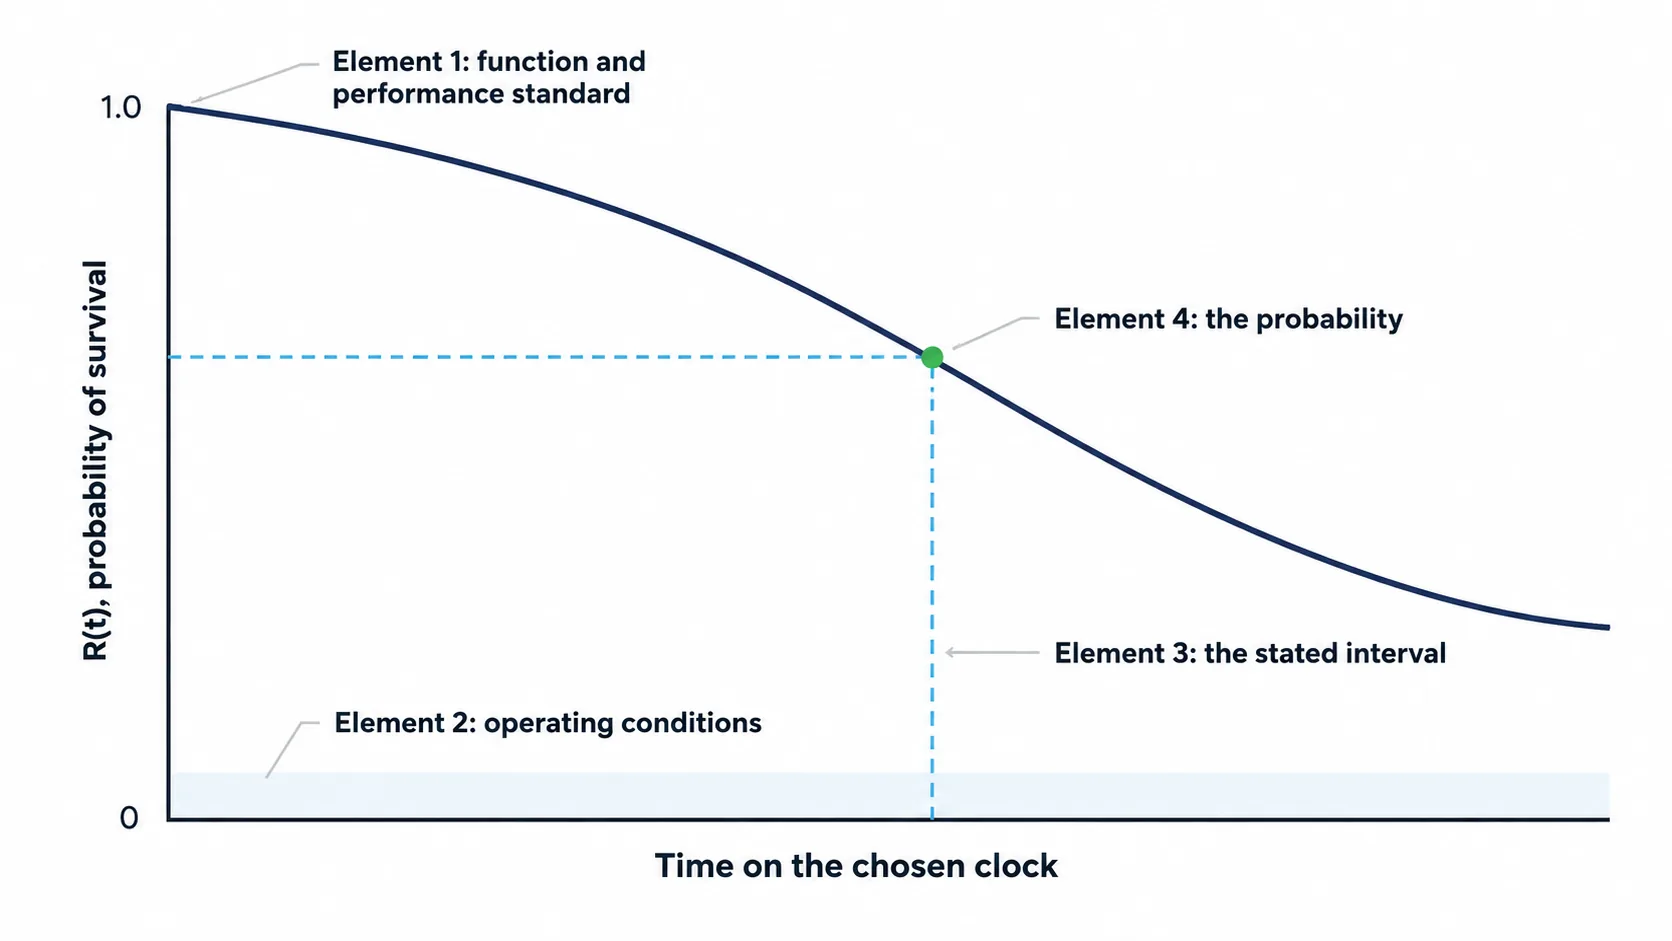
That sentence can be tested against data. It can be costed, because the 6% shortfall has a consequence that can be valued. It can be improved, and the improvement can be measured. Every one of those things was impossible for "the primary screen is reliable", and the only thing that changed was the addition of the four elements.
The same four elements build three different things, and keeping them apart matters. A reliability statement describes observed or estimated behaviour, a requirement specifies behaviour that must be demonstrated and belongs in a specification, and a target expresses an intention to improve. Confusing them is how a specification ends up containing an aspiration.
Reliability, Availability, Maintainability and Safety Answer Four Different Questions
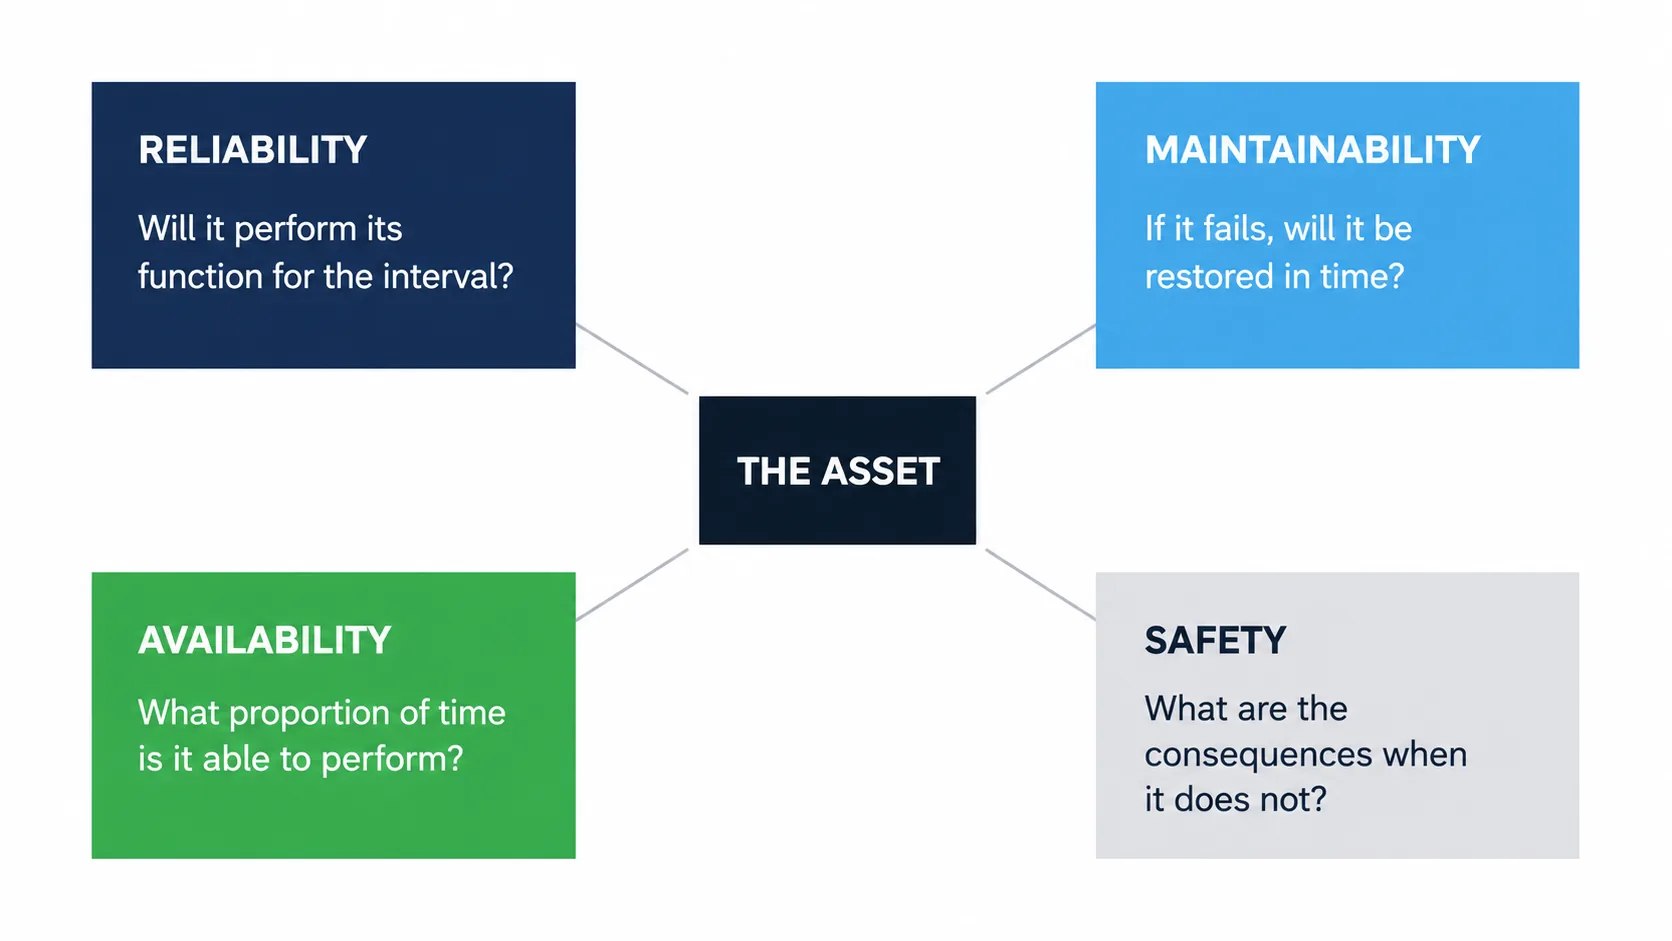
These four are not degrees of the same thing. They are four separate questions about the same asset, and answering one does not answer the others.
Reliability asks: what is the probability it performs its function for the interval? Maintainability asks: given that it has failed, what is the probability it is restored to functioning condition within a stated time (MIL-HDBK-338B 1998)? Availability asks: what proportion of the time is it in a state to perform its function? Safety asks: what are the consequences when it does not, and are they tolerable? Together these are usually referred to as RAMS, and a mature programme manages all four explicitly rather than treating availability as a proxy for the rest.
The confusion between reliability and availability is worth demonstrating with numbers, because it is the most consequential of the four.
Take two pumps. Pump A fails on average once every 2,000 operating hours, and because the seal kit is a long-lead item it takes 40 hours to restore. Pump B fails once every 200 operating hours, and because the parts sit on site and the repair is well drilled it takes 4 hours. Their inherent availability, the measure that considers only corrective maintenance, is MTBF divided by the sum of MTBF and MTTR (MIL-HDBK-338B 1998).
- A_i
- inherent availability, considering corrective maintenance only
- MTBF
- mean operating time between failures
- MTTR
- mean time to restore the item to functioning condition
Pump A returns 2,000 / 2,040 = 0.9804. Pump B returns 200 / 204 = 0.9804. The two figures are identical to four decimal places, and a report that carries only availability presents these two pumps as equivalent.
They are not remotely equivalent. Pump B fails ten times as often. Over a 1,000-hour production campaign, treating the hazard as constant for the purpose of this comparison, Pump A has a 60.7% probability of completing the campaign without a failure and Pump B has a 0.7% probability. Pump A will probably run the campaign through. Pump B will almost certainly interrupt it, roughly ten times, and each interruption consumes a crew, a permit and a production window even though each one is short.
Which pump you would rather own depends on what you are optimising, and that is precisely the point. Availability alone cannot tell you, because it has already averaged the distinction away. Reliability and maintainability are the two questions underneath it and both have to be asked separately.
Why the Definition Is the Foundation of Everything That Follows
Every technique in reliability engineering is a way of estimating, decomposing or acting on the four elements.
A life data analysis estimates R(t) for a defined population, function and context. A probability plot displays that estimate and exposes whether the population was actually homogeneous. A hazard function describes how the risk changes as the interval extends. A reliability block diagram composes component R(t) values into a system R(t). An availability calculation combines reliability with maintainability. A replacement interval calculation converts the shape of the risk into a cost-justified decision about when to intervene.
None of it works on an undefined population, an undeclared function, an unstated context or a missing interval. The mathematics is unforgiving about this in a specific and slightly unfair way: it returns a confident, well-formatted, entirely invalid answer rather than an error. A distribution fitted to a mixed population still produces parameters. A reliability figure quoted without an interval still fits in a report. The failure is silent, which is exactly why the discipline has to sit at the front.
So the practical takeaway is smaller than it sounds and harder than it looks. Before any analysis, write the statement out in full. Name the item class and the function. Write the performance standard as a measurable limit. State the operating context and exclude anything that does not share it. Choose the clock that matches the damage mechanism, and say why. Then, and only then, put a probability on it.
Do that consistently and the analysis that follows is defensible, because every number in it traces back to a definition someone can check. Skip it and every subsequent calculation, however sophisticated, inherits an ambiguity that no amount of mathematics will remove.
Frequently asked questions
What is the definition of reliability in engineering?
Reliability is the probability that an item performs a required function, under stated conditions, for a stated period of time. It is a statement about how a population behaves over an interval, expressed as a probability, not a property an individual machine has the way it has a mass. Four elements sit inside that sentence and every one is load bearing: remove any single element and what remains cannot be calculated, tested, budgeted or improved.
What are the four elements of a reliability statement?
The required function and its performance standard, written as a measurable limit with a unit, a measurement method and a location. The conditions under which the function is required, meaning duty, load, speed, temperature, ambient conditions, feed characteristics and operating pattern. The stated interval, measured on the clock that matches the damage mechanism. And the probability itself, which is only interpretable once the other three have fixed what it is a probability of.
What is the difference between reliability and availability?
Reliability asks what the probability is that an item performs its function for the interval. Availability asks what proportion of the time it is in a state to perform its function, which combines reliability with maintainability and can average the distinction away. Two pumps can return an identical inherent availability of 0.9804 while one fails once every 2,000 operating hours and the other fails ten times as often, so a report carrying only availability presents them as equivalent when they are not.
Why does the choice of time base matter in reliability analysis?
Because damage accumulates with use rather than with the passage of days, and the right time base is the variable the damage actually tracks. Operating hours suit run-time driven mechanisms such as bearing fatigue and lubricant degradation; cycles or starts suit transient stress such as thermal fatigue; throughput suits abrasive wear on a mill liner, chute or pump wet end; calendar time suits genuinely time-driven mechanisms such as atmospheric corrosion and elastomer ageing. Get it wrong and the analysis answers a different question from the one you asked.