
In brief
- A mechanical seal costs $340, but when it fails with no replacement on the shelf, the organisation does not lose $340: it loses the days it takes to locate, expedite and fit a replacement, and on a bottleneck asset with no standby, that outage can run into millions.
- Spare parts management sits at the intersection of four variables rarely brought together deliberately: criticality, demand pattern, lead time and capital allocation.
- The same criticality classification that sets maintenance frequency and inspection interval for an asset should also set how its spares are stocked, with demand pattern, dependent or independent, deciding whether a scheduling formula or a probability one applies.
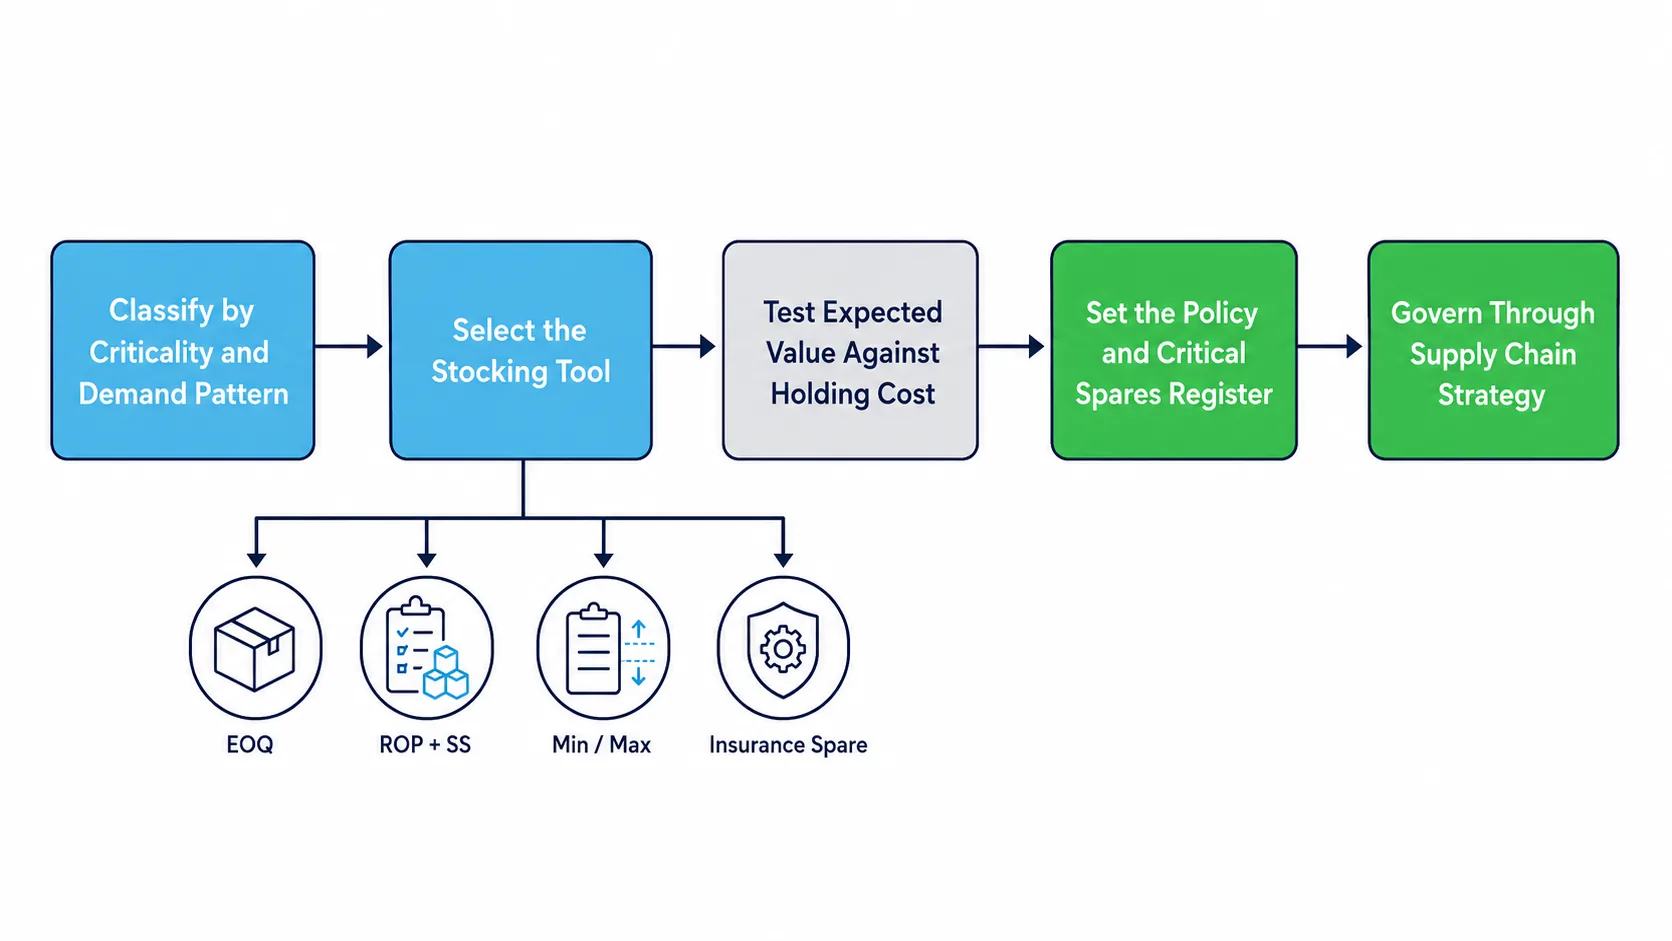
- Fast-moving parts are sized with Economic Order Quantity, critical low-frequency parts are protected with a reorder point and safety stock, the long tail runs on a simple minimum and maximum policy, and a few high consequence items are held as insurance spares.
- An expected value test weighs the cost of holding stock against the probability and consequence of a stockout, which is why criticality, not unit price, should be the first filter applied to any stocking decision.
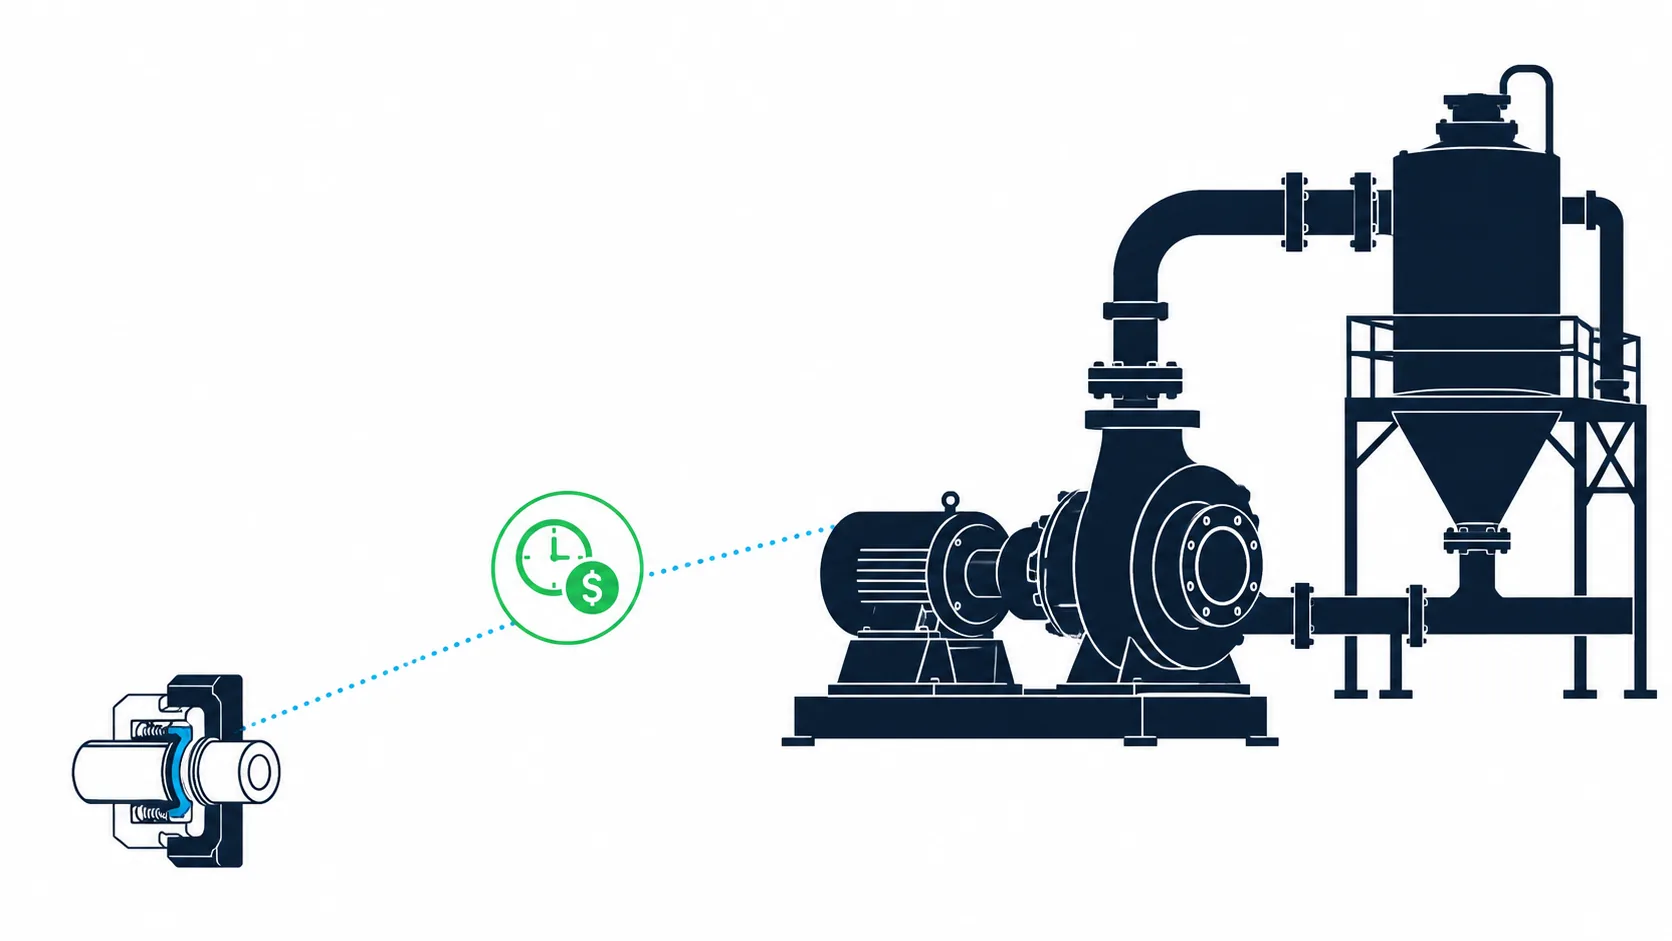
A mechanical seal costs $340. The pump it protects feeds the primary circuit on a processing line handling 28,000 tonnes of ore a day. When that seal fails with no replacement on the shelf, the organisation does not lose $340. It loses the days it takes to locate, expedite and fit a replacement, and on a bottleneck asset with no standby, that outage can run into millions. The gap between what a part costs and what its absence costs is the entire spare parts management problem in one sentence.
Spare parts management sits at the intersection of four variables rarely brought together deliberately: criticality, demand pattern, lead time and capital allocation. Get it right and the correct part is on the shelf without capital tied up in stock that never turns over. Get it wrong and the organisation pays twice, once in downtime, once in dead stock nobody remembers ordering.
This is an asset management decision, not a warehousing task, grounded in the same criticality thinking that shapes maintenance strategy and capital planning elsewhere in the system. What follows covers classifying spares correctly, sizing routine orders with Economic Order Quantity, setting reorder points and safety stock for what cannot run out, testing whether that stock is worth its holding cost, and building a supply chain strategy for remote, technically complex operations.
Spare Parts Management Is an Asset Management Decision, Not a Warehouse Task
Ask why a part is stocked at its current quantity, and "that is what we have always ordered" should not be an acceptable answer.
Spare parts management is the set of decisions, classification, demand forecasting, stock-level setting and supply chain design, that determines which components an organisation holds, in what quantity, and through what replenishment mechanism, so that asset availability is protected at the lowest justified cost of capital tied up in stock. That places the decision inside the asset management system, not beside it. The same criticality classification that sets maintenance frequency and inspection interval for an asset should also set how its spares are stocked: a component behind a Vital, high consequence-of-failure asset warrants different treatment to the identical part sitting behind a Desirable one.
Criticality alone is not sufficient. Two components can carry the same consequence rating and still need opposite stocking treatments, because failure frequency and lead time are separate questions from failure cost. The sections below apply a different quantitative tool to each combination rather than one formula to everything on the shelf.
Not Every Spare Deserves the Same Stocking Logic
A $40 filter and a $180,000 gearbox do not belong in the same stocking policy, and neither do two $40 items if one turns over weekly and the other has failed twice in a decade.
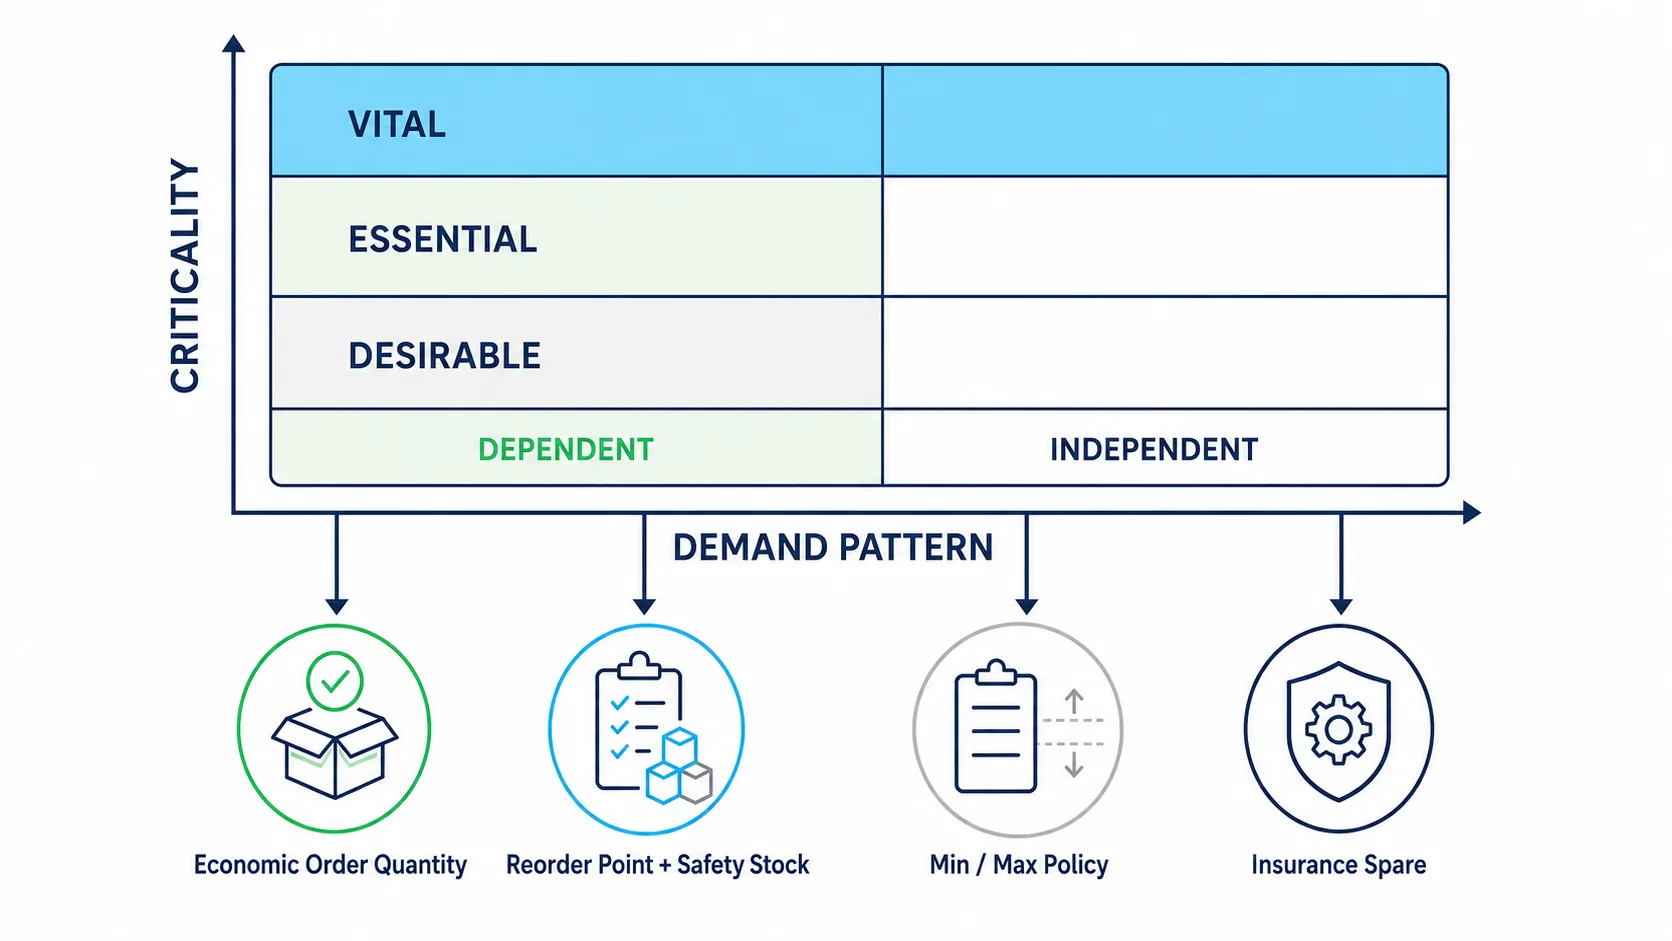
The starting classification is criticality: Vital items, without which mainstream operation stops or a serious safety or environmental consequence follows; Essential items, where a workaround exists but performance or cost is materially affected; and Desirable items, where absence has minimal impact. Unit cost adds a second lens: high-value items justify tighter control regardless of turnover, low-value items can run on simple rules even moving constantly.
The lens most stocking policies skip is demand pattern. Dependent demand can be forecast from a production plan or maintenance schedule: filters replaced on a fixed interval, wear parts consumed at a known rate per tonne processed. Independent demand is consumed by unplanned events, a bearing that fails when it fails, not on a calendar. Dependent demand is a scheduling problem; independent demand is a probability problem, and keeping that distinction clear is what stops a formula built for predictable consumption being applied to a part that only moves when something breaks.
Put criticality, cost and demand pattern together and the stocking logic sorts into four categories, each covered below.
- Fast-moving, dependent-demand items are sized with Economic Order Quantity, since consumption is steady enough that the only real question is order size.
- Critical, independent-demand items with meaningful lead time are protected with a reorder point and safety stock, sized to the organisation's risk tolerance rather than a guess.
- The long tail of low-criticality, low-value items runs on a simple minimum and maximum policy, since full statistical treatment is not justified by the consequence of a minor quantity error.
- A small number of high consequence, low probability items are held as insurance spares, a judgement rather than a formula, reserved for parts whose absence would leave a critical asset down for months.
Sizing the Order: What Economic Order Quantity Actually Optimises
For the parts that turn over often and predictably, the question is not whether to stock them. It is how much to order each time.
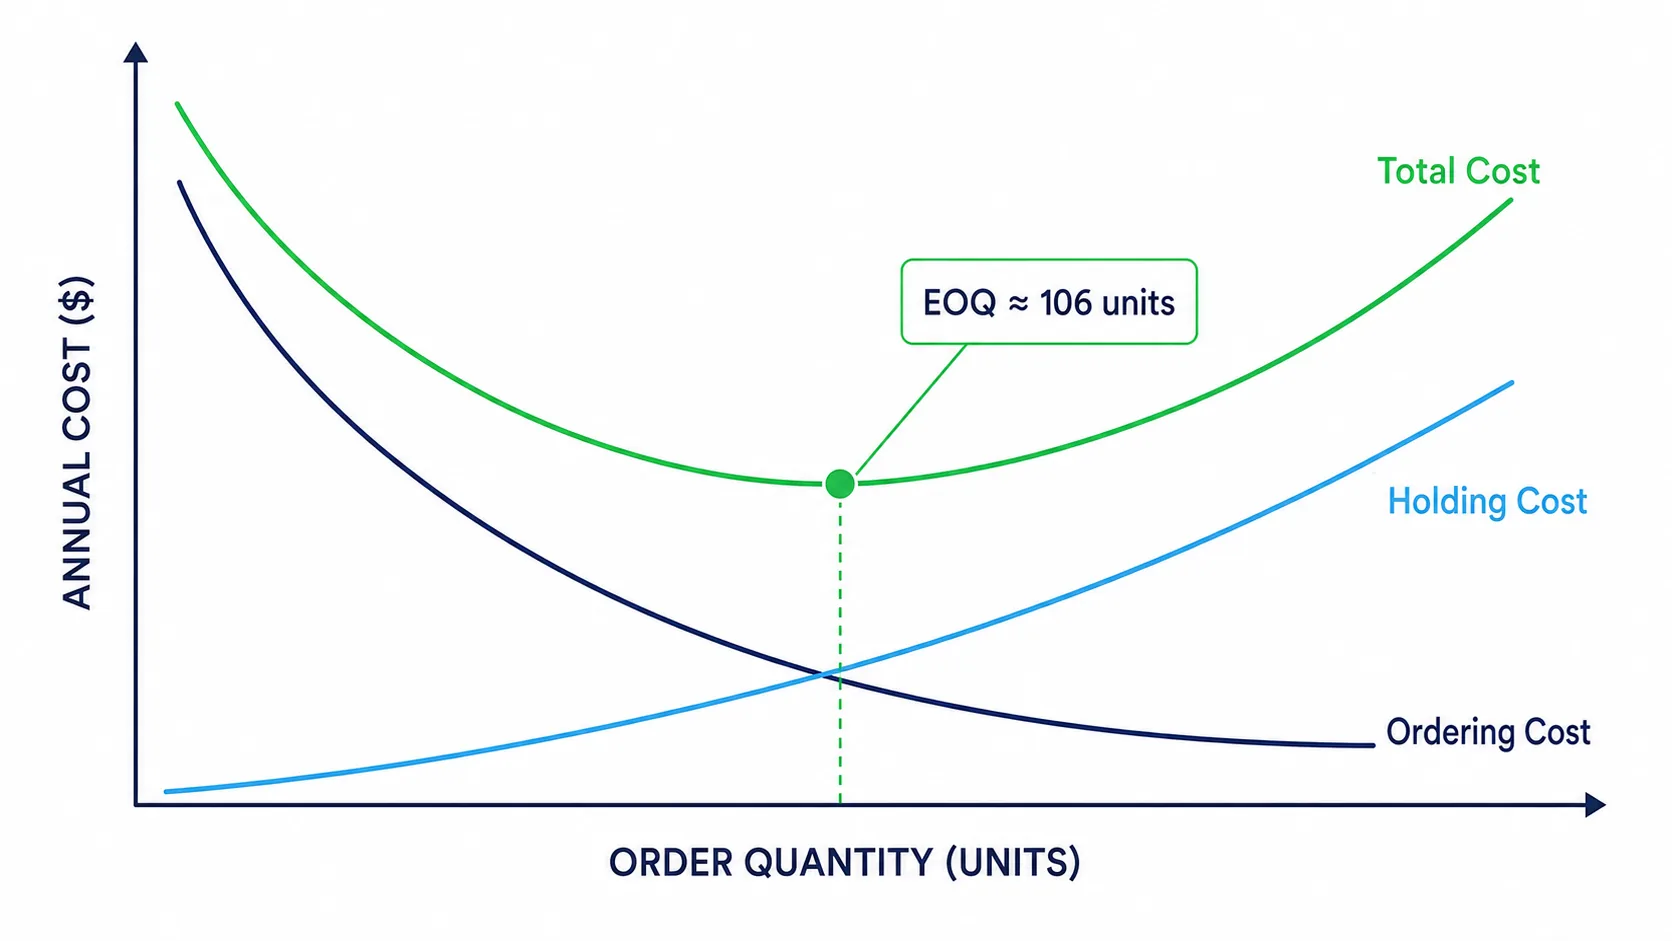
Economic Order Quantity answers that question: EOQ = √(2DS/H). D is annual demand in units. S is the cost of placing a single order, administration, freight, receiving and inspection, independent of order size. H is the annual cost of holding one unit in stock for a year, typically a percentage of unit cost capturing capital, storage, insurance and obsolescence together.
The trade-off is straightforward: order too often in small batches and ordering cost dominates, since every order carries the same fixed burden regardless of size; order too rarely and holding cost dominates, since more capital sits idle for longer between deliveries. EOQ is the quantity at which these two cost curves cross.
Illustrative example
A processing site consumes conveyor idler roller bearings at a fleet-wide rate of 600 units a year, a fast-moving, dependent-demand item on a large conveyor network. Each order costs $85 to place and process. Unit cost is $45, and the site applies a 20 per cent annual holding rate, giving H = $9 per unit per year. EOQ = √(2 × 600 × 85 ÷ 9) = √11,333 ≈ 106 units. At that order size the site places roughly 5.6 orders a year, one every 65 days, at a combined annual ordering and holding cost of approximately $958, the lowest achievable for this item under this demand pattern.
EOQ works well precisely because idler bearing demand is steady and roughly continuous. That assumption is also its limitation: applied to a part that fails twice in ten years fleet-wide, the formula returns either a meaningless order quantity or false precision about demand that is, in reality, close to random. Critical, low-frequency spares need a different question: not what minimises ordering and holding cost, but what stock level gives an acceptable probability of not running out before the next delivery lands.
Protecting Against the Failure That Cannot Wait
The pump seal that fails twice a decade fleet-wide does not fit an EOQ model, and forcing it into one leaves sites overstocked on what does not matter and short on what does.
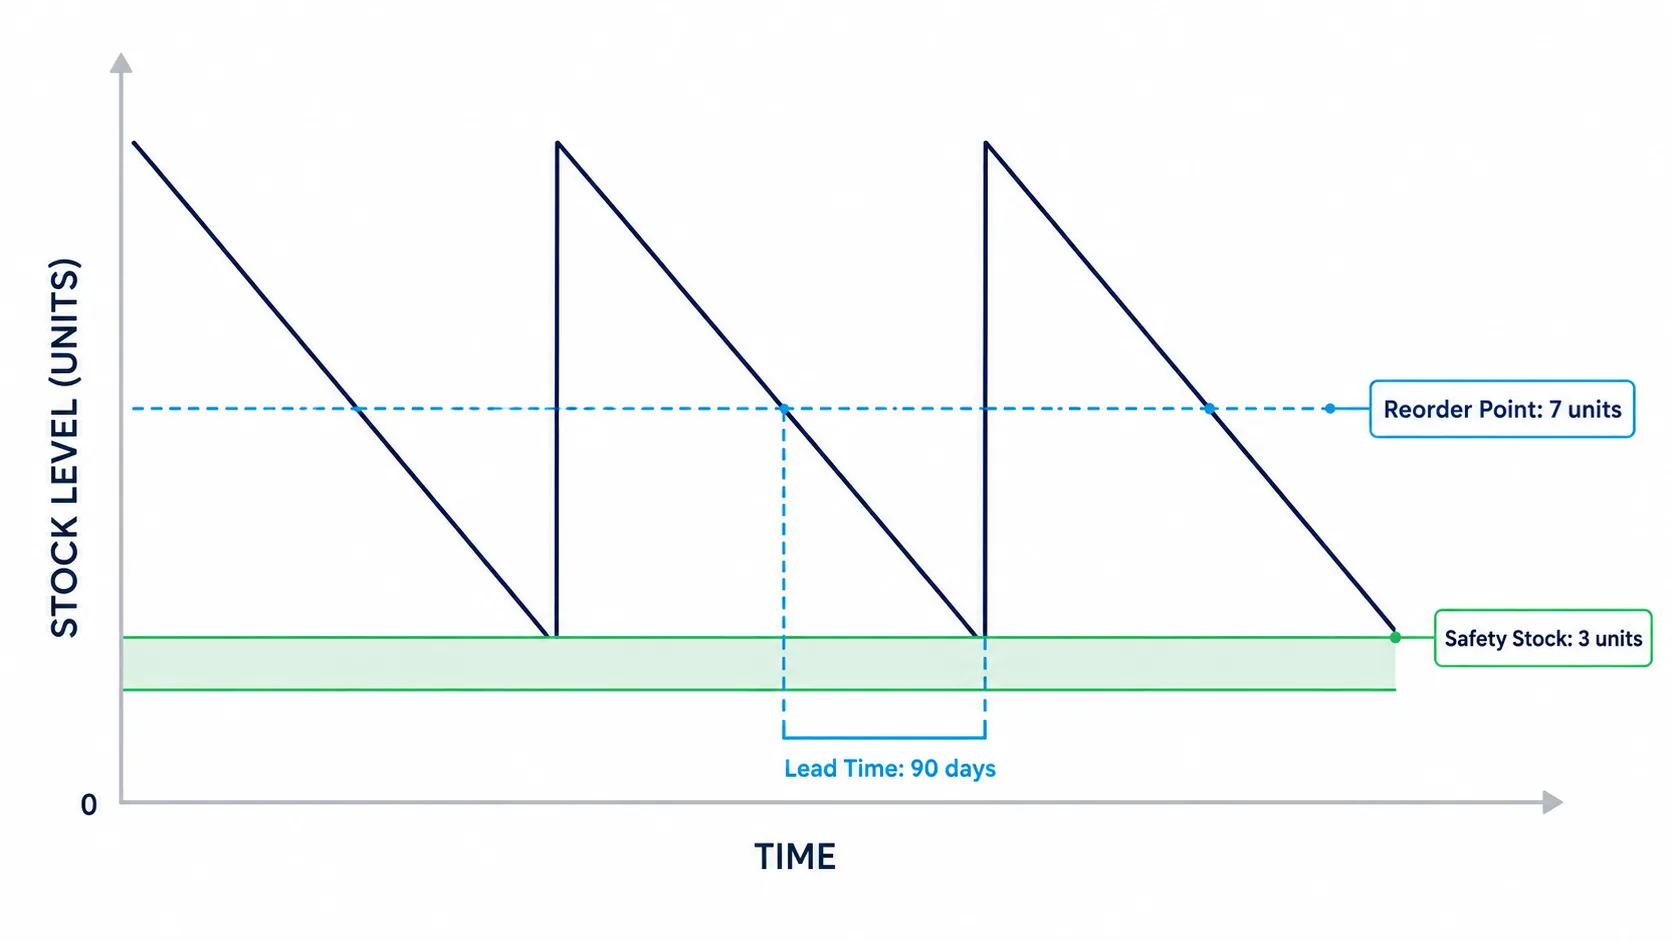
For critical items with independent, low-frequency demand and meaningful lead time, two figures matter: the reorder point, which triggers a new order, and the safety stock, the buffer that absorbs demand variability while a replacement is in transit.
Reorder Point = (average daily demand × lead time in days) + safety stock. In long lead time environments, remote sites and offshore facilities routinely running 90 days or more on sole-sourced OEM components, the lead time term dominates, and getting it wrong by weeks moves the reorder point substantially.
Safety Stock = Z × σd × √LT, where Z is a service level factor reflecting the accepted probability of not stocking out (1.65 for a 95 per cent service level), σd is the standard deviation of daily demand, and LT is lead time in days. Service level is, in plain terms, a risk tolerance decision: how comfortable is the organisation running without a buffer for the roughly one time in twenty that demand exceeds the average during replenishment.
Illustrative example
Consider a fleet of 40 identical slurry pumps on critical processing duty, each fitted with a mechanical seal sole-sourced from the manufacturer on a 90-day lead time covering sea freight and customs clearance. Three years of maintenance records show fleet-wide seal replacement averaging 0.04 units a day, around 14.6 a year, with a daily demand standard deviation of 0.19 reflecting genuinely lumpy, unscheduled failure. At a 95 per cent service level, Safety Stock = 1.65 × 0.19 × √90 = 1.65 × 0.19 × 9.49 ≈ 2.97, rounded up to 3 seals. Reorder Point = (0.04 × 90) + 3 = 3.6 + 3 ≈ 6.6, rounded up to 7. The site reorders at 7 units and, under normal variability, expects stock to run down toward the 3-unit safety buffer by the time the replacement lands, covering the great majority of demand scenarios along the way.
Is the Stock Worth What It Costs to Hold?
Three seals sitting in a store for a year are not free, and neither is being one seal short when the fleet's next failure happens.
Once a safety stock quantity is calculated, it still has to earn its place. The test is a simple expected value comparison: the probability of a stockout event, multiplied by its consequence value, weighed against the annual cost of holding the stock that prevents it.
Illustrative example
Continuing the pump seal example: an uncovered failure means emergency procurement and expedited freight add an estimated 6 days to the outage compared with a stocked replacement fitted immediately. On this single-train asset with no standby, that adds an estimated $180,000 a day in lost production, or $1,080,000 per stockout event. Fleet history puts the probability of a failure occurring while stock is exhausted at roughly 0.85 times a year without the safety buffer, so expected annual exposure is 0.85 × $1,080,000 ≈ $918,000.
Holding 3 seals at $28,000 each ties up $84,000 of working capital, costing approximately $16,800 a year to carry at a 20 per cent holding rate. In this illustrative scenario, the downtime exposure the safety stock offsets is around 55 times its annual holding cost, which is why criticality, not unit price, should be the first filter applied to any stocking decision. A $28,000 seal preventing a million-dollar outage is inexpensive insurance; the same amount held against a low-criticality item with no comparable consequence is simply capital sitting idle against the site's inventory-to-Replacement Asset Value (RAV) benchmark, which is exactly why classification matters more than any formula applied alone.
Setting Min/Max Policy and Knowing When to Buy Insurance
Most parts sitting in any industrial store do not justify a formula at all, and spending analytical effort pretending otherwise wastes time better spent on the handful that do.
For the long tail of low-criticality, low-value inventory, a simple minimum and maximum policy, reorder at the minimum, order up to the maximum, reviewed periodically rather than continuously modelled, is the right level of rigour. Where an item is flagged critical but does not warrant full statistical treatment, lifting its reorder level by a fixed margin, around 25 per cent, is a fast, defensible way to build in a safety margin without running a safety stock calculation on every stock-keeping unit a typical site carries.
At the far end of the spectrum sit insurance spares: items where the probability of ever needing one is low, but the consequence of not having it is high enough that holding it anyway is the correct decision. This is a judgement rather than a formula, typically applied to major rotable components, a spare gearbox, motor or drive train, where lead time or fabrication time would otherwise leave a critical asset down for months. For expensive, repairable components, many sites run a rotable pool instead: a failed unit is removed, a serviceable one installed immediately, and the failed unit enters repair for return to the pool. Pool size is a function of failure rate and repair turnaround, not a reorder point calculation, and deserves the same periodic review as any other critical stocking decision.
Supply Chain Strategy for Remote and Technically Complex Operations
None of this stocking discipline survives a supply chain that cannot deliver what the model assumes it can.
Supply chain management, in the asset management context, is the process ensuring provisioning of equipment, tools and materials stays aligned with asset management objectives across the asset's full life, weighing total cost of ownership rather than purchase price alone. It spans purchasing, inventory, warehousing and contracting, including the outsourcing and insourcing decisions determining whether critical spares sit on an organisation's own shelves or a supplier's.
Remote mining sites and offshore oil and gas facilities carry constraints most industries never plan around: lead times measured in months, single ports of entry, and OEM components with no viable alternate source. Sole-source dependency inflates price and lead-time risk together, and it is precisely the most exposed items, complex, engineered, safety-critical components, that carry the highest consequence of a stockout. Three levers consistently reduce this exposure.
- Framework and blanket purchase agreements lock in pricing and priority production slots ahead of need, turning an emergency purchase into a budgeted transaction.
- Multi-sourcing wherever a technically equivalent alternative exists breaks single-supplier dependency for the subset of components where an equivalent is genuinely available.
- Vendor-managed inventory for high-turnover consumables shifts holding cost and replenishment responsibility to the supplier, freeing capital and attention for the critical items that need it.
The items identified through the classification, reorder point and insurance spare analysis above belong on a formally maintained critical spares register, reviewed on the same cycle as the criticality ratings that feed it. Supply chain strategy for spare parts is not a procurement function operating alongside the asset management system: it is governed the same way every other element of the Asset Management Plan is, tracing back through criticality to the Strategic Asset Management Plan and the objectives it exists to serve.
The Discipline Behind the Shelf
A $340 seal and a three-day stockout are not really a story about a seal. They are a story about whether the analytical work, classification by criticality and demand pattern, Economic Order Quantity for what moves predictably, reorder point and safety stock for what does not, and an honest expected-value test in between, was done before the part was needed rather than after. Heavy asset industries do not get to choose whether their supply chains are tested. Remote locations, long lead times and sole-source OEM parts guarantee that they will be. What is chosen is whether the response is a defensible, criticality-driven policy or a best guess.
Spare parts management, done properly, is one of the more cost-effective disciplines inside an asset management system: the analysis is inexpensive, and in almost every case, so is the stock it justifies, relative to what an unplanned stockout actually costs. The discipline is in classifying honestly, applying the right formula to the right item, and revisiting the result as conditions change rather than treating a stocking policy as a decision made once.
Frequently asked questions
What is spare parts management?
Spare parts management is the set of decisions, classification, demand forecasting, stock-level setting and supply chain design, that determines which components an organisation holds, in what quantity, and through what replenishment mechanism, so that asset availability is protected at the lowest justified cost of capital tied up in stock. That places the decision inside the asset management system, not beside it.
What is the difference between dependent and independent demand for spare parts?
Dependent demand can be forecast from a production plan or maintenance schedule: filters replaced on a fixed interval, wear parts consumed at a known rate per tonne processed. Independent demand is consumed by unplanned events, a bearing that fails when it fails, not on a calendar. Dependent demand is a scheduling problem; independent demand is a probability problem.
What is Economic Order Quantity (EOQ)?
Economic Order Quantity answers how much to order each time for parts that turn over often and predictably: EOQ = the square root of (2DS/H). D is annual demand in units, S is the cost of placing a single order, and H is the annual cost of holding one unit in stock for a year. It is the order size at which ordering cost and holding cost balance, the lowest combined cost for a fast-moving, dependent-demand item.
How is safety stock calculated for critical spare parts?
Safety Stock = Z multiplied by the standard deviation of daily demand multiplied by the square root of lead time, where Z is a service level factor reflecting the accepted probability of not stocking out (1.65 for a 95 per cent service level) and lead time is in days. Service level is, in plain terms, a risk tolerance decision: how comfortable the organisation is running without a buffer for the roughly one time in twenty that demand exceeds the average during replenishment.